Join us never trade alone-we help traders like you become more profitable with our proven market forecasts & signals.
Have you ever second-guessed your trades? Our expert forecasts allow you to validate and confirm your own analysis.
Master Elliot Wave analysis like a pro and gain the advanced strategies needed fir successful trading.

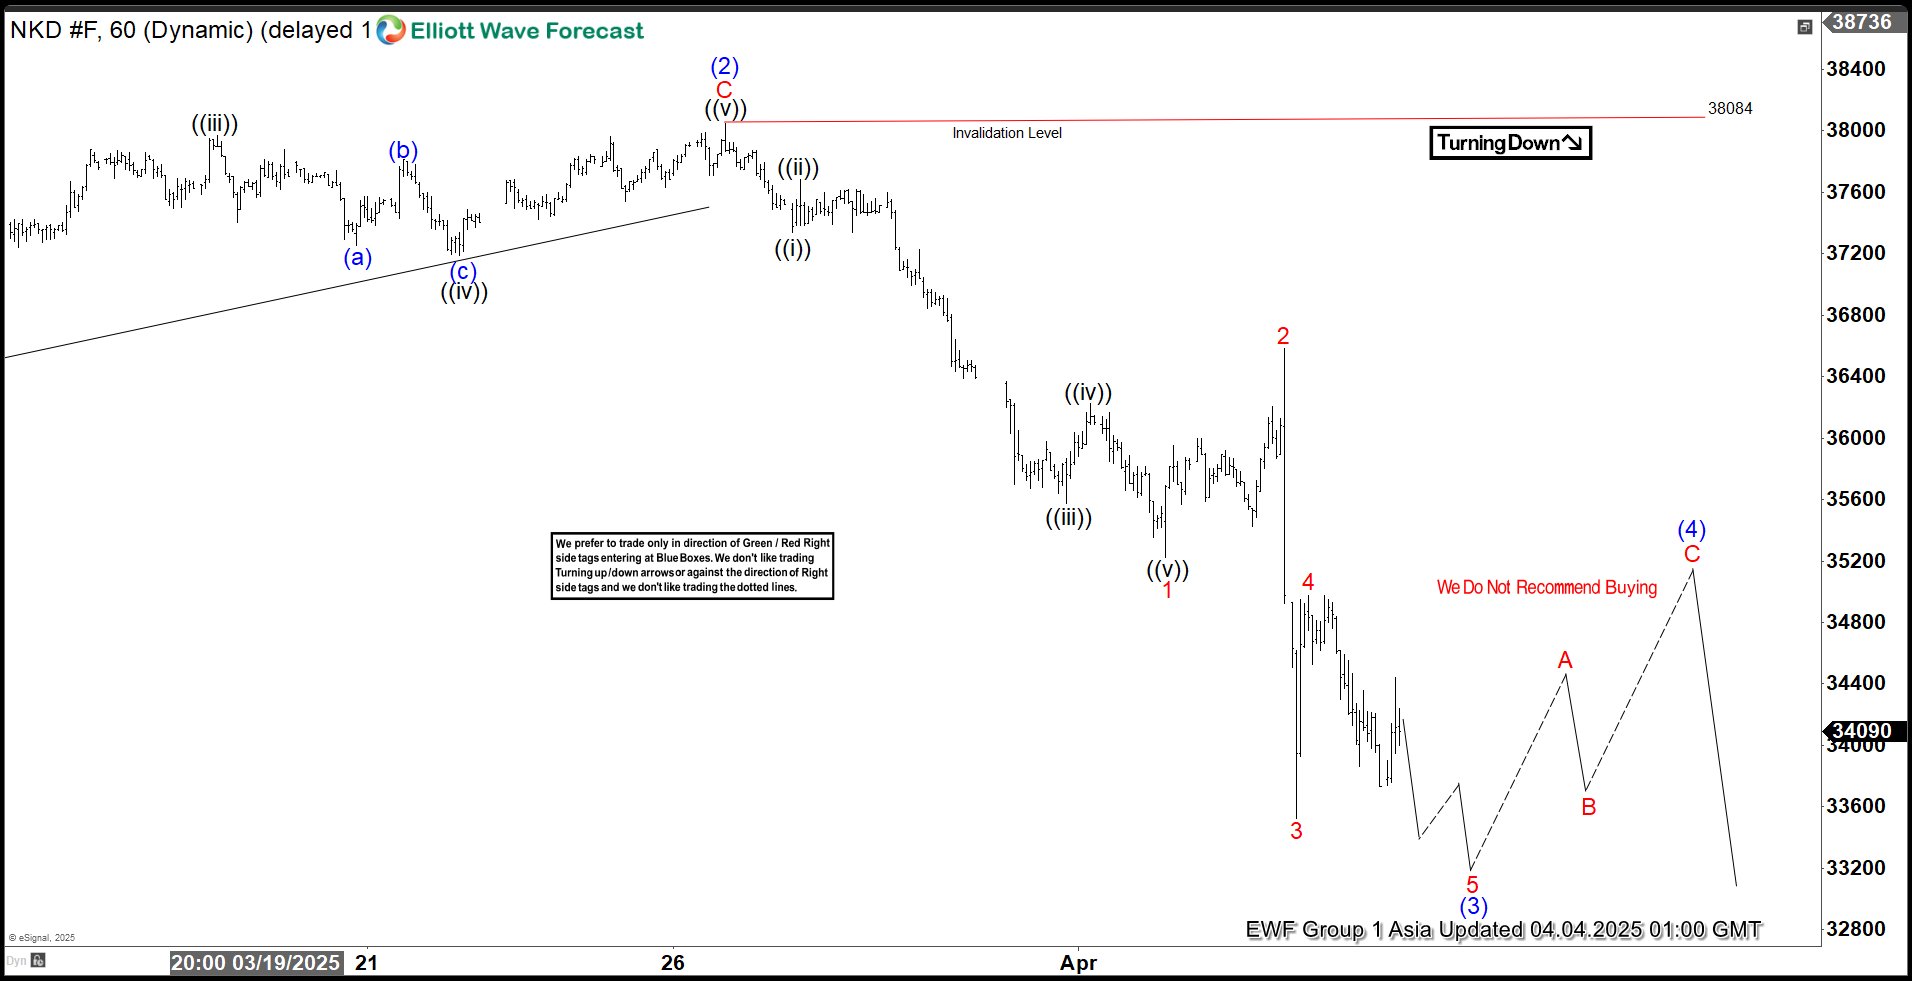
The Nikkei (NKD) has been trending lower since its peak on July 8, 2024. We indicate this decline follows a "double three" Elliott Wave pattern, characterized by a series of distinct movements. After reaching that high, the index fell to 30,720, rebounded to 40,675, and is now progressing downward in a zigzag formation as the internal within "w...
Learn More >In this blog, we take a look at the past performance of Netflix charts. In which, the stock is showing perfectly reacting higher from blue box area.
Hello, fellow traders! If you’re new to Elliott Wave, this article will guide you on where to begin. Elliott Wave Theory is one of the most powerful methods used in technical analysis to predict financial market cycles and trends. By identifying extremes in investor psychology, it offers a structured way to analyze the market. Elliott […]
BYD Company Limited (ticker: 1211.HK in Hong Kong Stock Exchange) breaks in wave 3. This article looks at the Elliott Wave path.
Hello fellow traders, As our members know we have had many profitable trading setups in Indies recently. In this technical article, we are going to present another Elliott Wave trading setup we got in SPX E-Mini ( ES_F ) . ES_F completed this correction precisely at the Equal Legs zone, referred to as the Blue […]